Analytics are the foundation of improvement. RiftSurge provides comprehensive statistics and insights that help you understand your team's performance at a deep level.
This guide will help you navigate the analytics dashboard, understand what each metric means, and use the data to make better strategic decisions.
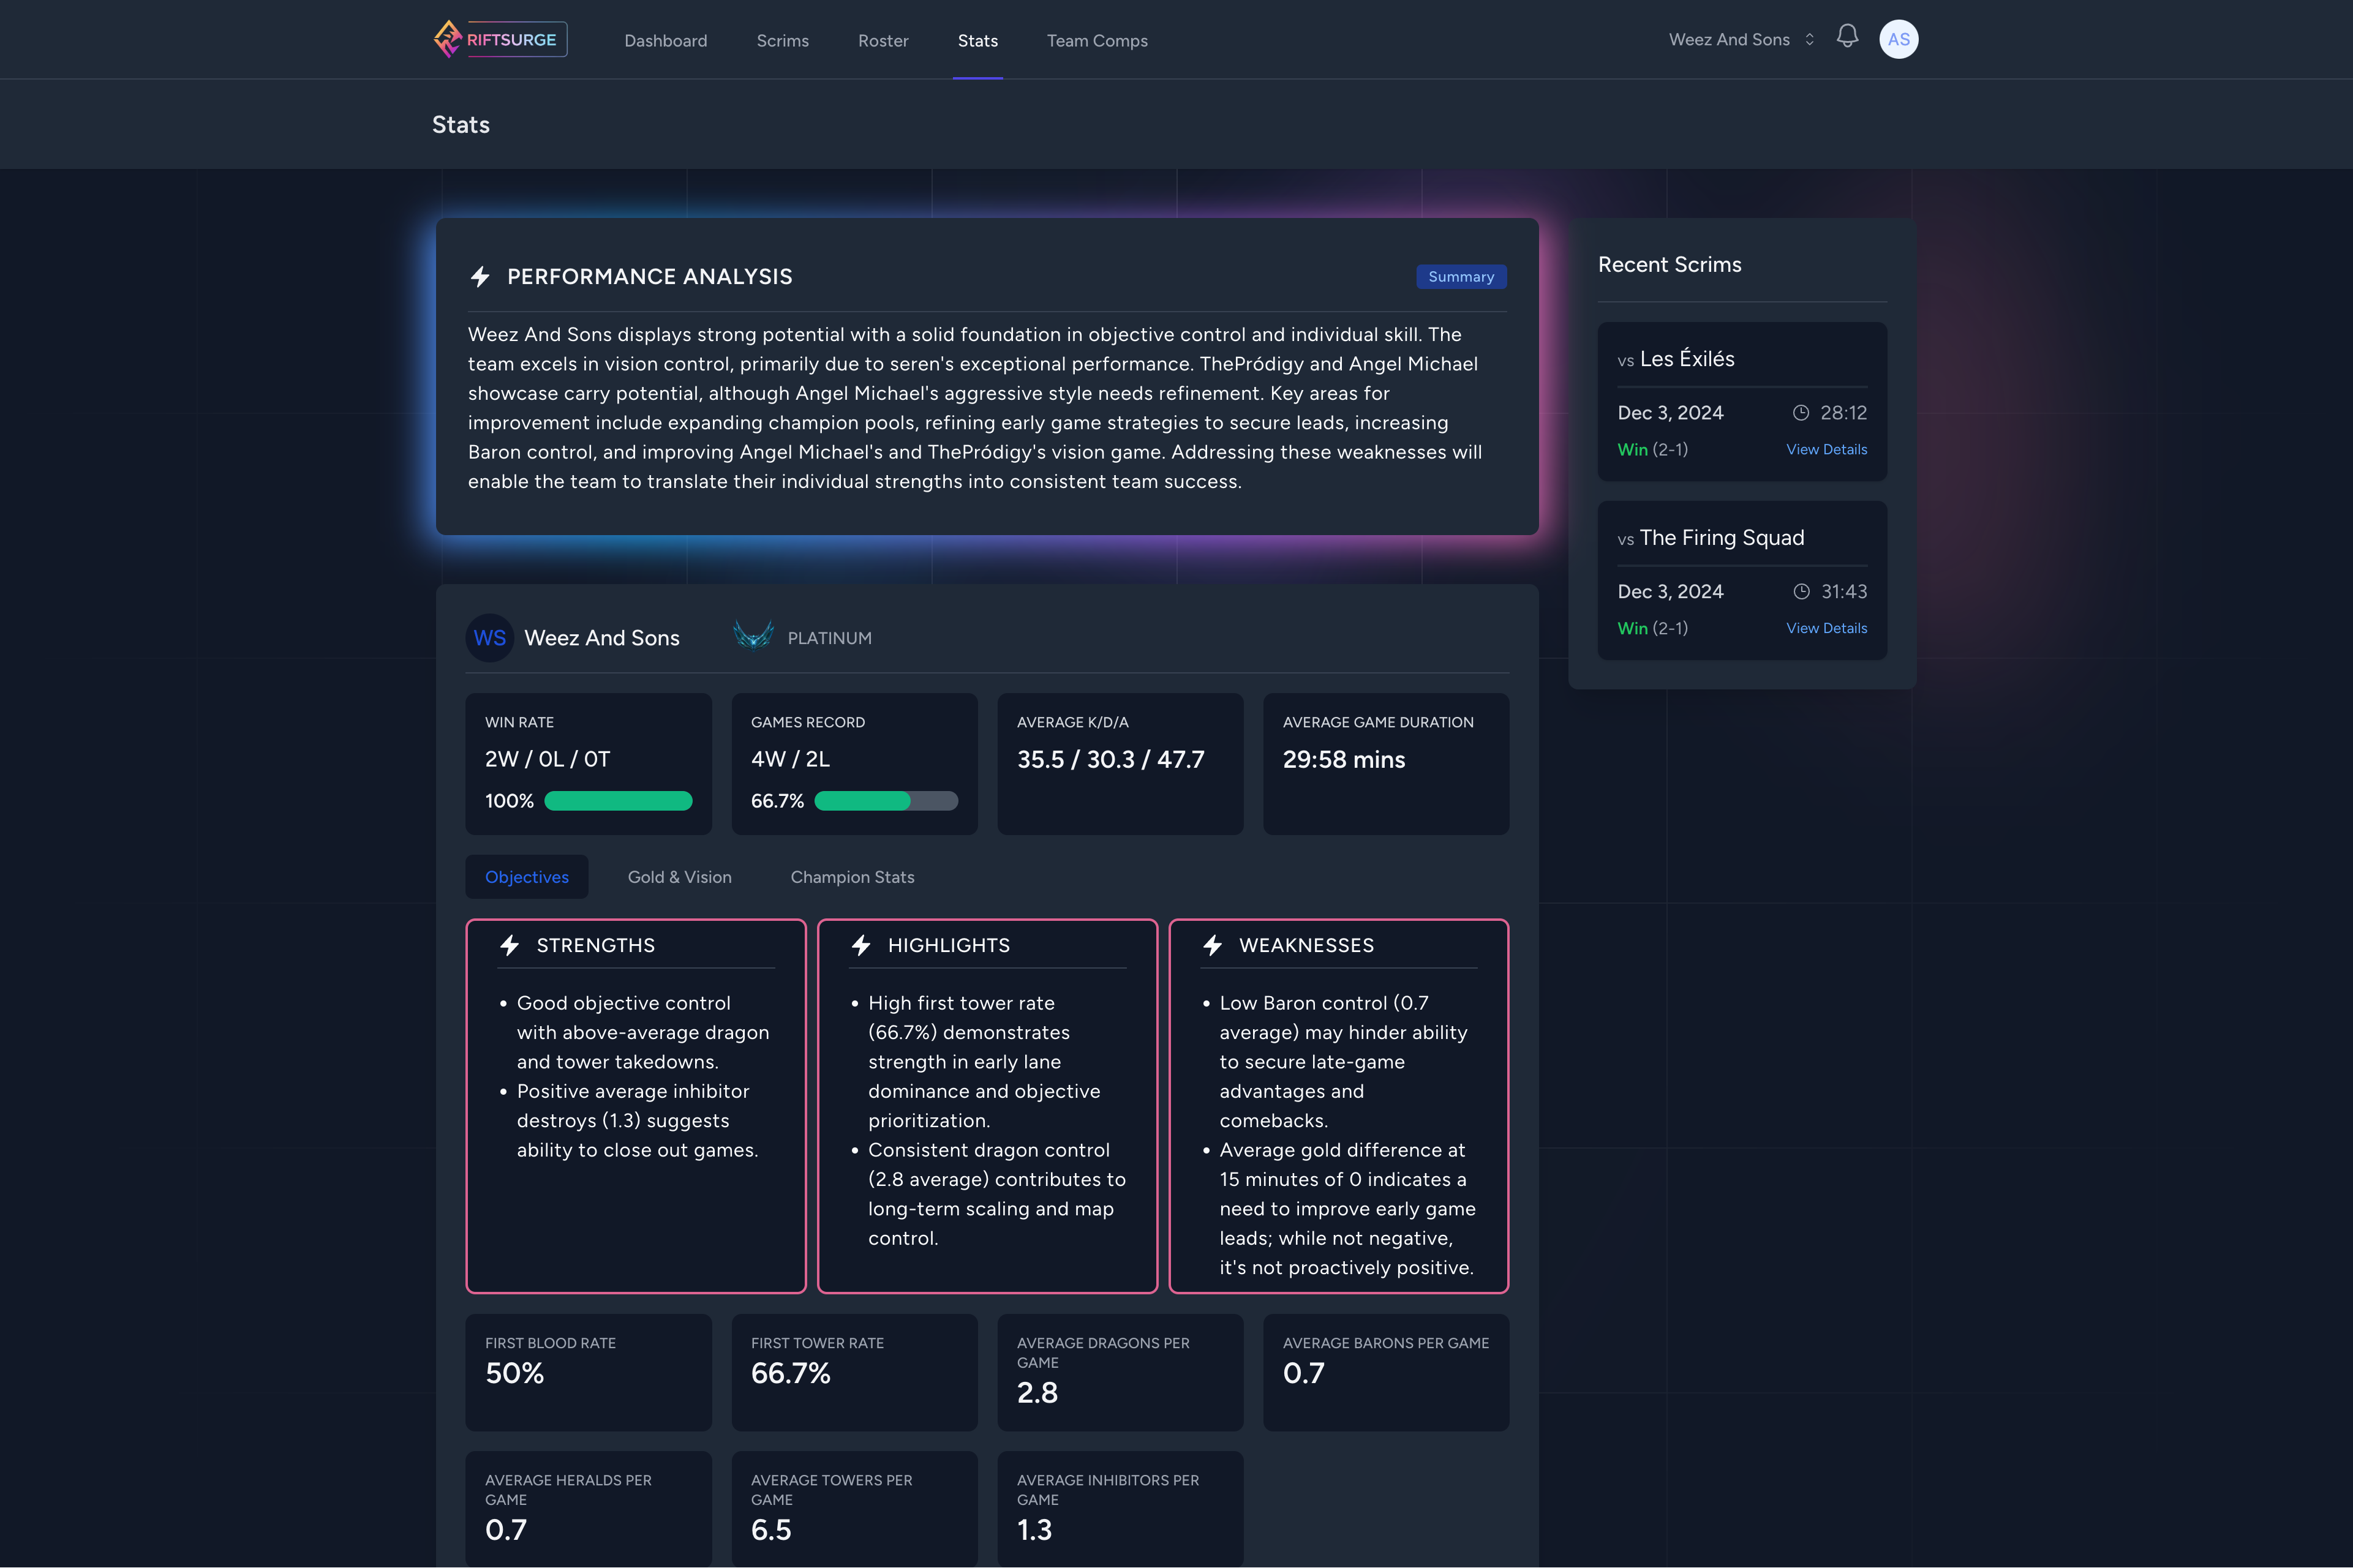
Analytics Dashboard Overview
Your analytics dashboard is divided into several key sections, each providing different insights into your team's performance.
Team Overview
High-level team statistics, win rates, and recent performance trends.
Player Statistics
Individual player performance, champion pools, and role-specific metrics.
Composition Analytics
Win rates by composition, champion synergies, and draft effectiveness.
Game Analysis
Detailed breakdowns of individual games with timeline visualization.
Spot which compositions and game plans consistently deliver wins.
Understanding Key Metrics
RiftSurge tracks dozens of metrics, but here are the most important ones to understand:
Win Rate
Your overall win rate across all tracked games. Track this over time to see improvement trends.
Tip: Compare win rates by composition, game mode, or time period to identify what works best for your team.
Objective Control
How often your team secures key objectives (Baron, Dragon, Rift Herald). Strong objective control correlates with higher win rates.
Tip: Review games where you lost despite good objective control—this might indicate late-game execution issues.
Gold & Experience Graphs
Visual representation of your team's economic advantage throughout games. Shows when you're ahead or behind.
Tip: Look for patterns in when you gain or lose leads to identify strengths and weaknesses in different game phases.
Composition Win Rate
How successful your team compositions are. Track which champion combinations work best for your playstyle.
Tip: Build a playbook of your most successful compositions and practice them regularly.
Player Performance Analysis
Individual player statistics help identify strengths and areas for improvement. Each player has their own detailed analytics page.
What to Look For:
- • Role Performance: How well each player performs in their assigned role
- • Champion Pool: Which champions each player excels with
- • Improvement Trends: Whether players are getting better over time
- • Consistency: How reliable each player's performance is
Use player analytics to make informed decisions about roster changes, role assignments, and individual coaching focus areas.
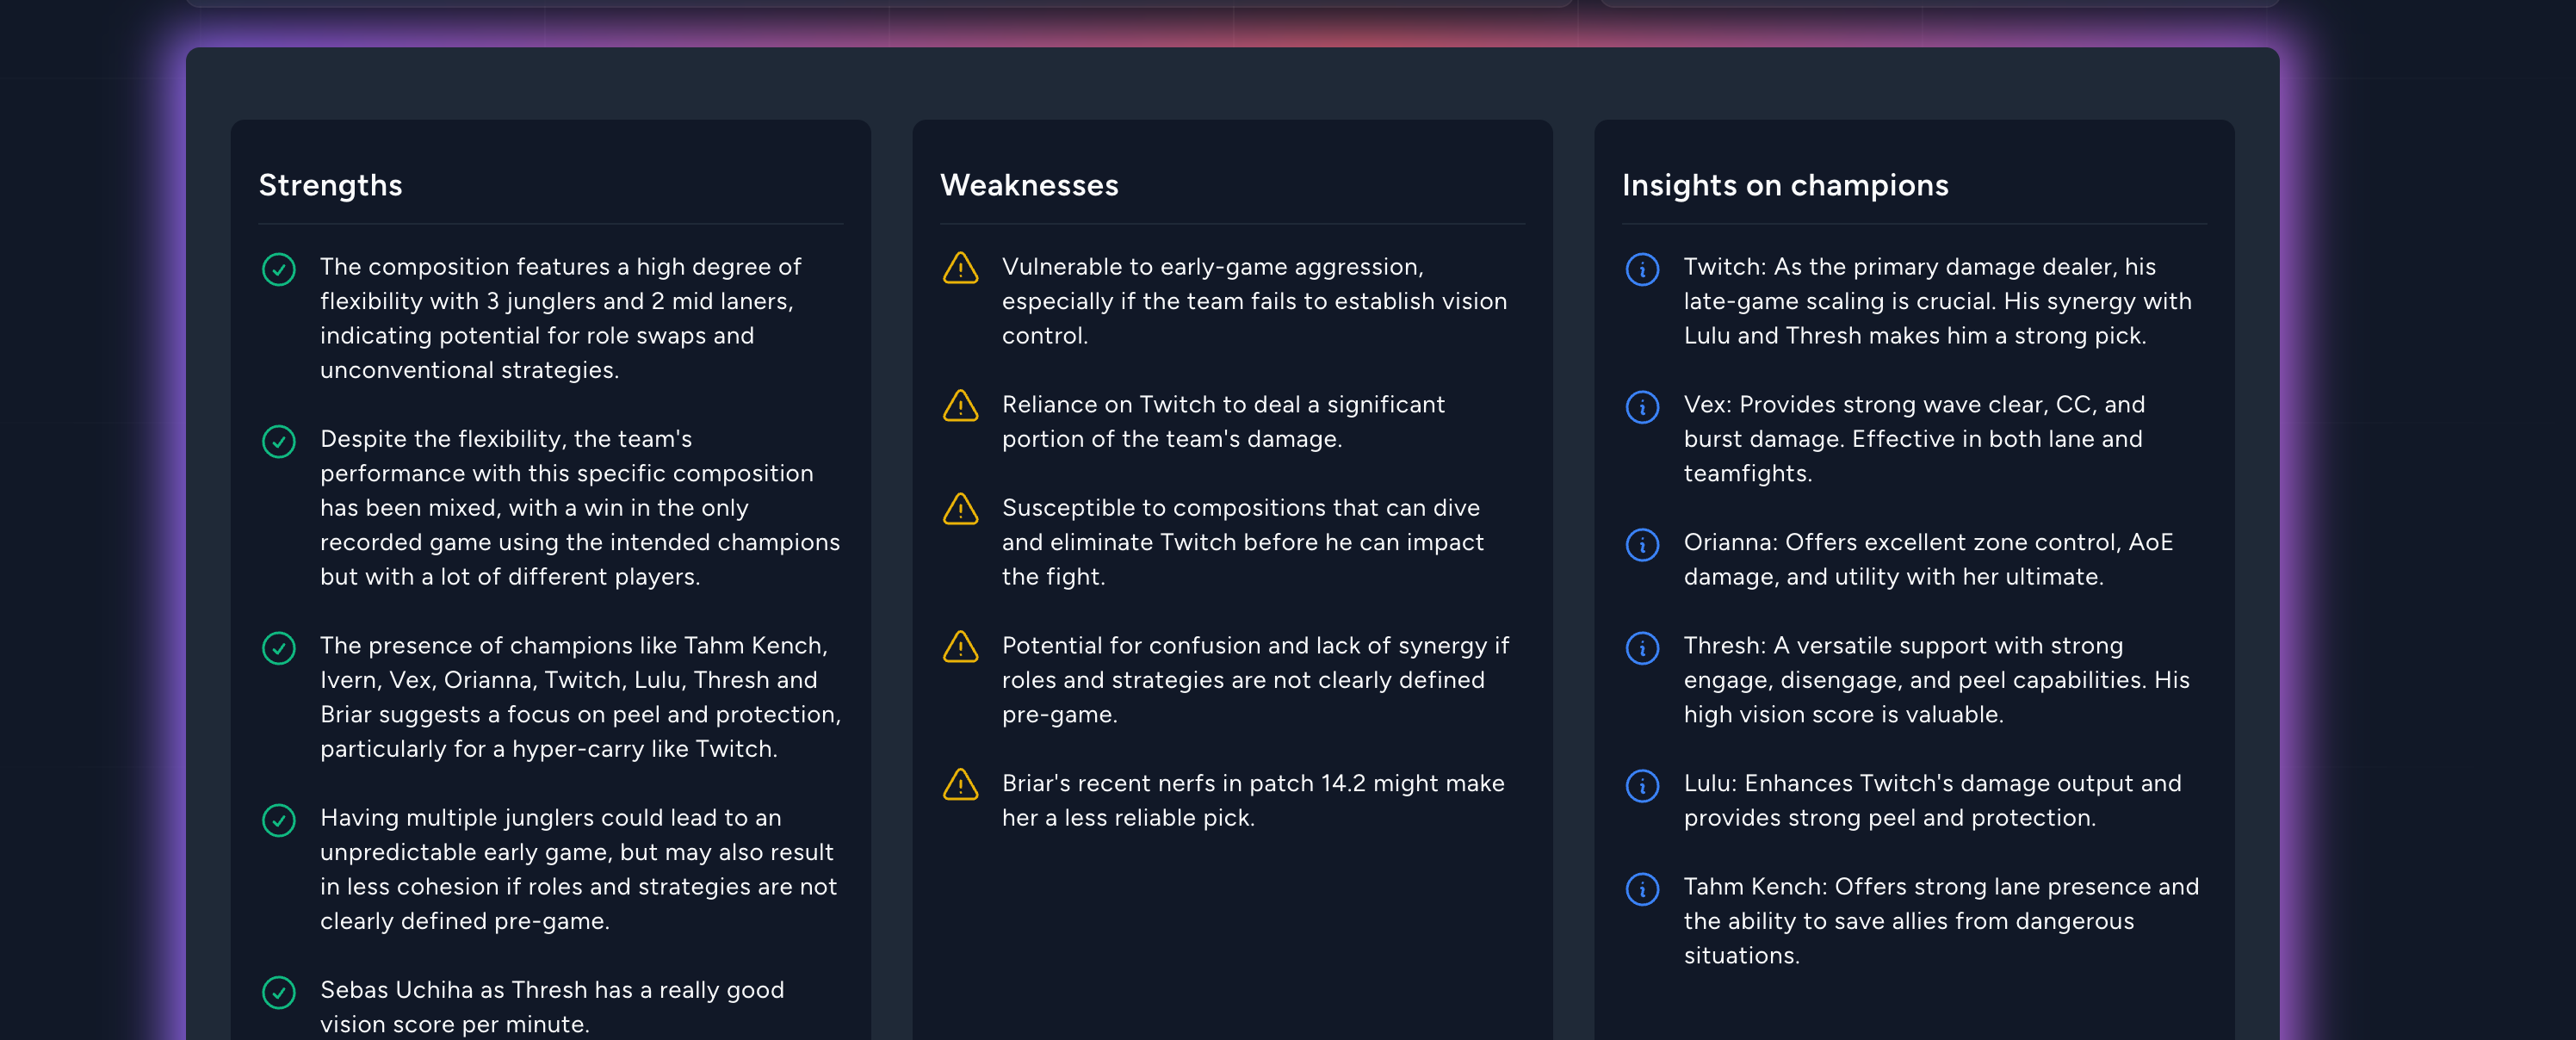
AI-Powered Insights
RiftSurge's AI analyzes your team's data and provides personalized insights that go beyond raw statistics.
What AI Insights Provide
- • Personalized composition recommendations based on your team's champion pools
- • Identification of patterns in wins and losses
- • Strategic recommendations for improvement
- • Weekly analysis summaries highlighting key takeaways
AI insights become more accurate as you play more games. Make sure to review them regularly—they often highlight opportunities you might miss.
Share insights with your team to align on the next practice focus.
Making Data-Driven Decisions
Analytics are only valuable if you act on them. Here's how to use your data effectively:
Look for recurring themes in wins and losses. Do you struggle in late game? Early game? Against specific compositions?
Use your current metrics as baselines and set improvement goals. Track progress over time.
Focus scrim practice on areas where data shows you need improvement.
Set aside time each week to review analytics as a team and discuss insights.